Measure Interference in Crowded Spectrum
Wireless technology is so widespread that the frequency spectrum can be quite crowded. Almost every portion of available frequency spectrum is shared by multiple services and/or applications, requiring practical, effective control of interference. To eliminate interference, it must first be isolated and identified. Hunting down sources of interference can be challenging, if not nearly impossible.
One example is trying to find short-duration intermodulation signal products without the right tools, or without knowledge about antenna types, signal characteristics, and other factors. Hopefully, this overview of interference-locating techniques and some examples will help accelerate the success of future interference-hunting efforts.
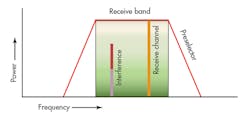
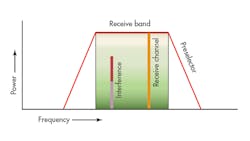
1. Interference can occur when there is energy inside the preselector of the victim receiver.
Locating interference starts with finding the right measurement tool, a process which can be aided by understanding the differences between different spectrum analyzer types. Two common spectrum analyzer types are swept-tuned spectrum analyzers and real-time spectrum analyzers. Swept-tuned spectrum analyzers are typically based on a superheterodyne receiver architecture in which signals are mixed with a tunable local oscillator (LO) to cover a bandwidth of interest from a starting frequency to a stop frequency.
A real-time spectrum analyzer samples a portion of the frequency spectrum and uses digital-signal-processing (DSP) techniques to analyze the captured spectrum. Filtering occurs in both approaches, and filtering helps set an analyzer’s resolution bandwidth (RBW), by which signals closely spaced in frequency can be isolated and identified.
Interference can cause degraded system performance. For example, the unwanted energy may be causing coverage, reception, or access problems for a communications system. Problems can include an adequate signal but poor reception; an adequate signal but intermittent or no access; or a poor signal and no reception. Three basic types of interference are the most common:
- Co-channel interference is one of the simplest forms of interference, where more than one transmitter can be found on the same channel. This is not unusual, given that many frequencies and frequency bands are at least partially shared by numerous applications or users.
- Adjacent-channel interference results from energy originating from a transmitter other than the one intended. Such a secondary transmitter could be geographically close or close in operating frequency, and operate at a much higher power level than the intended transmitter.
- Intermodulation-based interference occurs when energy from two or more transmitters mixes together to create spurious signal products or frequencies. In general, third-order spurious products are the most common intermodulation interference caused by only two sources, although this type of interference can be caused by more than two sources. Transmitters that produce this type of interference are usually close together and at higher power levels.
Figure 1 shows the simplified function of a preselector filter within a receiver. Although the filter is tuned to remove interference, interference can occur in a receiver when there is energy inside the preselector’s filter bandwidth. Suitable energy within the preselector bandwidth can impact receiver performance; it does so by blocking the receiver directly from detecting a desired signal, or else through a form of desensitization in which lower-level signals are not detected.
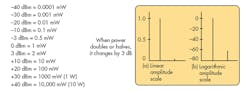
2. The logarithm scale provides the ability to look at very fine signals. This means that a very small signal change on a spectrum analyzer display equals a very large change in the linear output of a signal.
Protocol-based test tools have often been used to identify interference. While they are useful in finding interference, such tools are also limited in providing insight into how a system might be impacted by interference and in identifying the types of interference that can cause the most harm to a system. For such purposes, a spectrum analyzer provides a clear view of a given portion of spectrum, thus pinpointing where interference might fall relative to a communications system of interest.
When seeking a spectrum analyzer for finding interference, a key specification to consider is probability of intercept. This is simply the minimum duration of an interfering signal and the chance that the analyzer can detect and display it. Swept-tuned spectrum analyzers typically have a low probability of intercept, meaning that the interfering signal would have to be present for tens of milliseconds. Real-time spectrum analyzers, have a high probability of intercept to their maximum span, with the capabilities of detecting signals as brief as microseconds. Such analyzers can identify signals that are of much shorter duration than a traditional swept-tuned spectrum analyzer.
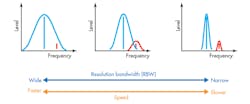
3. This shows why RBW settings are important for interference applications. Wide RBW is faster, but may lead to missed signals.
Spectrum analyzers show captured signals on a logarithmic (rather than linear) scale, with signals and interference displayed in decibels (dB) or decibels relative to 1 mW (dBm) power. The logarithmic scale makes it possible to show a much wider dynamic range on an analyzers screen than a linear scale.
There are a few tricks to relate dBm values to a linear difference (Fig. 2). Because it is logarithmic, every 10-dB change in power is a power of 10 change in wattage. Similarly, a 3-dB change in power represents a doubling (up 3 dB) or halving (down 3 dB) of wattage. Measurement of +30 dBm is the same as measuring 1 W, while measuring +33 dBm is the same as measuring 2 W. This can be significant, since most spectrum analyzers are limited to about +30 dBm input power, and feeding an analyzer excess power can damage the instrument.
For interference applications, a spectrum analyzer’s RBW control is very important. It is a filter that helps discriminate between wide- and narrow-bandwidth signals in the same span by changing the RBW value (Fig. 3). If the RBW is set too wide [Fig. 3 (left)], smaller signals close to larger signals will be lost. A narrow RBW filter can easily discriminate between two signals that are close together, but it will slow down the spectrum analyzer. This requires a longer measurement duration to ensure signal probability of intercept.
The Importance of RBW
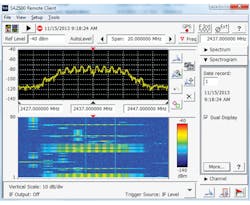
For a comparison, analyzers were used to view activity in the 2.4-GHz Industrial-Scientific-Medical (ISM) band. The left side of Fig. 4 shows a traditional swept-frequency spectrum-analyzer display. The type of detector, number of traces, RBW setting, and number of trace points all contribute to the speed of the acquisition. The right side of Fig. 4 shows a real-time spectrum analyzer display of the same spectrum with somewhat more information.
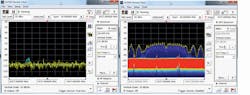
4. A real-time spectrum analyzer display shows much more information than a traditional display.
For each pixel on the display, the real-time analyzer keeps track of how often energy is measured at that pixel with a decay function, essentially mimicking old-fashioned phosphorous displays. Real-time spectrum analyzers are available with real-time bandwidths to 165 MHz and real-time transform rates to 390,000 transforms/s. In this view, color shows how often a signal appears, with red indicating the noise floor and blue the Wi-Fi signal.
Another powerful tool available with a real-time spectrum analyzer is the spectrogram. It is akin to adding time as a third dimension to a traditional power-versus-frequency plot, providing the spectrum analyzer with a history of previous measurements in the frequency domain. As each spectrum measurement is made, the result is “turned on edge” and added to the bottom of the spectrogram. This pushes the older spectra up the display. Each line of the spectrogram is made in this way.
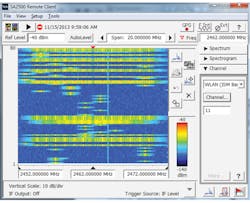
5. The spectrogram allows you to record spectrum for long periods of time and playback problem periods.
The horizontal axis is frequency, exactly as in the spectrum display. The power of each signal (which was represented by vertical height in the spectrum display) is now represented by different colors. The vertical axis is now time, with each line representing the time required for the FFT to be performed. As shown in Fig. 5, the spectrogram can record spectrum for long periods of time and the user can then playback any problem periods.
Measuring and locating interference is often a matter of situational awareness. Enough must be known of the surroundings to determine whether an analyzer display is showing a system problem or an interference problem. Gaining an understanding of the frequency band of interest is essential, learning for example whether is it licensed or license-free spectrum, and what is the band plan for the spectrum and whether co-channel services are in use. Various channel plans may be based on a class of service, with different power levels for each.
A spectrum display may show much different power levels whether a portion of the spectrum is used for uplink or downlink functions. The class of service also dictates emission bandwidth and modulation type. Also, certain digitally modulated signals can have much higher crest factors than their analog counterparts.
Spectrum shape is also important. This is equivalent to occupied bandwidth. Much can be learned about an unknown signal by its spectrum signature. Occupied bandwidth, crest factor, and duration are unique properties which can help identify an unknown signal.
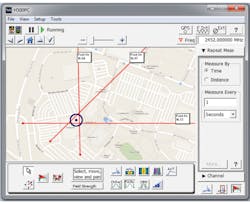
6. Lines of bearing on a map show the target ellipse or area of uncertainty.
In terms of their effects on signals, environment factors are difficult to classify. Signals can be affected differently whether a communications system is surrounded by buildings or in a wooded area. Even more, the impact of a wooded area can change depending upon the time of year. Signal and environmental factors must be understood when analyzing potential interference, and maintaining logs of signal activity can help to discover when interference actual occurs.
Triangulation Trials
Locating a signal involves triangulation. The basic principle behind triangulating a signal is straightforward: determine bearings, measure azimuth and signal strength from two different locations, then plot the bearings on a map. In theory, the interference is originating from the location on the map where the two bearings intersect. But in practice, it can be somewhat more complicated to locate the source.
Antennas can cause some of the triangulation complexity. A multiband, directional antenna has different directivity characteristics based on frequency, which can be plotted on a chart. The back of the antenna also has a pattern, and the antenna a resulting front-to-back ratio. Such directivity characteristics can impact any attempts to locate a signal source. Understanding an antenna’s pattern can help to achieve optimum results with that antenna.
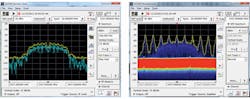
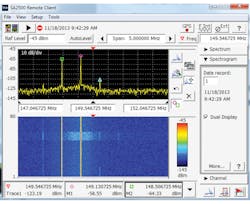
7. The real-time display shows a number of fast signals not visible in the traditional spectrum analyzer display.
The radio horizon of a subject receiver can complicate interference investigations. Cities, in particular, can pose difficulties because of their large numbers of reflections. Obtaining as many lines of bearing can minimize the problems, with an increase in the lines of bearing helping to reduce the amount of uncertainty in an interference search.
For any sweep of the horizon, a good practice is to have an external attenuator connected between the antenna and the spectrum analyzer, so that attenuation can quickly and easily be added to the receive signal path. Spectrum analyzers often have more sensitivity than required, and the additional attenuation can help minimize the effects of RF clutter as the antenna moves closer to the interference emitter.
Many spectrum analyzers include a mapping function that can help when plotting bearing lines. In the screenshot depicted in Fig. 6, the lines of bearing show the location of the target ellipse or area of uncertainty. In this case, the power levels are fairly high, meaning the area of intercept is fairly small. This increases confidence that the target is actually in that area.
Closer to the target, directional antennas are less useful since their directivity is more compromised. In such cases, a monopole or near-field antenna can provide better results. The pattern of the near-field antenna is of interest, since the antenna’s null rather than its peak can provide more directivity; it may even provide more directivity than a larger, more directed antenna.
As an example, assume a Wi-Fi network with degraded performance. The following is known about this IEEE 802.11bgn Wi-Fi network. It operates within the license-exempt, 2.4-GHz Industrial-Scientific-Medical (ISM) band. It has co-channel operation with other electronic products, including cordless telephones, baby monitors, and Bluetooth devices. Wi-Fi is a time-division-duplex (TDD) network, with transmission and reception occurring on the same channel, and it employs a channel plan with 11 discrete channels (with only three clear channels: 1, 6, and 11).
8. This spectrogram display shows the Bluetooth activity that represents interference for Wi-Fi systems operating in the same portion of spectrum.
When interference is suspected as a problem, an SSID scanner may be used to determine if there are co-channel issues, and how many access points are visible from the current operating location. A protocol scanner identified three access points, with channel 6 showing as the strongest.
When a traditional spectrum analyzer was used to view channel 6, conditions appeared reasonable, even with the instrument’s “max hold” and “averaging” functions turned on and with a triggered acquisition that performs measurements only when a specific signal power level has been reached. A real-time spectrum analyzer view of this same channel 6 reveals more activity, including a number of other carriers over the top of the signal (Fig. 7).
As to why these signals show on the real-time display and not the swept-tuned display, most likely they are high-speed, frequency-hopped signals that were not detected by the swept-tuned analyzer. Since this is the 2.4 GHz band and Bluetooth is part of this band, these could be Bluetooth signals.
To confirm whether this was the case, the next step was to turn on a signal classification database. By declaring a region in a signal, a spectrum analyzer can suggest what signal activity might be present. In this case, it indicated that 2.441 GHz is actually a Bluetooth channel—in particular, Bluetooth channel 39. As such, there is a high degree of probability that this is actually a Bluetooth signal.
A longer-term spectrogram measurement showed a fair amount of Bluetooth activity directly on that “Wi-Fi” channel. Both classes of service are supposed to be friendly when it comes to sharing spectrum; however, Fig. 8 shows that there is a great deal of Bluetooth activity right on top of this channel. There are two very small spurious signals inside the span which might be invisible in a regular spectrum display, particularly if the “max-hold” function was used.
As another example, consider an antenna farm with multiple transmitters facing system degradation of some form. The frequency of the victimized receiver is 149.77 MHz. The VHF land-mobile frequency plan has no defined frequency separation for transmit/receive functions, unlike applications at UHF and 800 MHz and, depending upon the time of year and location, there could be a great deal of propagation at this frequency.
Summing Up
In general, VHF applications are typically very narrow bandwidth, with occupied channel bandwidths as narrow as 6 kHz. Hence, radio receivers will be very sensitive compared to WiMax, LTE, or Wi-Fi stations.
An initial analysis suggested that the interference consisted of frequency-shift-keying (FSK) signals from the image of the class of service, and it is apparent that two frequency hops are clearly defined. A spectrogram analysis shows a point in time when another signal occurs on top of the initial signal. This additional signal is wider, but of shorter duration, possibly resulting from intermodulation.
9. Using a spectrogram display over time can confirm the presence of intermodulation signal products.
For intermodulation to occur, two or more sources are required. In this case, two sources are higher in power level but lower in frequency. For analysis, the next step involves examining the intermodulation mix to determine if the signal product would impact the system of interest. By using the spectrogram to study a longer period of time, it is possible to identify an intermodulation product, shown as the center line in the spectrogram display in Fig. 9.
The power of frequency number one is changing; it is actually increasing. And when the power increases, the result is an intermodulation product between the two frequencies on top of the assigned frequency.
With so many different electronic devices producing signals, it would be difficult to imagine that interference doesn’t exist for a particular band. A real-time spectrum analyzer can help isolate and identify interference, with a much higher probability of intercept than a traditional swept-tuned spectrum analyzer. For analysis, a spectrogram can help when studying spectrum activity over a time period of interest.
Because of the ever-changing wireless signal environment, as shown by the Wi-Fi example, traditional spectrum analyzers do not provide the capability to reliably detect and identify interference, but real-time spectrum analyzers have proven to be quite useful tools for finding interference.
Robin Jackman, Field Applications Engineer
Tektronix, Inc., Beaverton, OR, 14150 SW Karl Braun Dr., P.O. Box 500, Beaverton, OR 97077; (800) 833-9200
